Sales projection formula, that still works with messy pipeline data
A sales projection formula guide covering four calculation methods, five copy paste spreadsheet formulas, and one worked example showing the real spread.
 Michael Doyle12 min read
The sales projection formula multiplies a past sales figure by a growth rate, a win probability, or a seasonal index, depending on the method.
The simplest version: previous period sales times one plus the growth rate. One real pipeline run through five versions of it below produced results 109 percent apart, which is why the method you pick matters more than the formula itself.
Any projection is only as honest as the pipeline feeding it, which is why the stage rules in how to build a sales pipeline matter more than the formula itself.
What you need before you start
What this covers
This guide covers four ways to turn a pipeline or a sales history into a projected number, the exact spreadsheet formula for each, and a worksheet you can copy. It does not cover building a full forecasting model in Excel from a blank sheet. That gets its own guide.
Who this is for
You need one of two things: a few months of past sales figures, or a list of open deals with dollar values attached. Founders projecting a first year with no sales history yet will find the historical and seasonal methods useless, since both need a track record.
A pipeline based method still works with a handful of open deals, but only once outreach and research have actually filled that pipeline. Teams whose spreadsheet starts breaking past twenty open deals will want the opportunity stage method, since it scales without new tooling.
What a sales projection actually means
A sales projection is an estimate of future revenue built from a chosen method and a set of assumptions, usually covering a quarter, a year, or five years for a business plan.
A five year projection is the same formula run four more times, once per year, with the growth rate adjusted each round.
Getting the method right matters because most B2B sales organizations do not. Research from SiriusDecisions and Forrester, cited by MXM Revenue, found that 79 percent of sales organizations land more than 10 percent off their own number, with only 21 percent landing inside that band.
Sales projection vs sales forecast
People use the two terms interchangeably, but they answer different questions.
Characteristic | Sales projection | Sales forecast |
|---|---|---|
Primary question | What could revenue look like under a scenario | What will revenue likely be next period |
Time horizon | Often a year or several years | Usually a month or a quarter |
Update frequency | Revisited when assumptions change | Updated weekly or monthly as deals move |
Typical audience | Investors, a business plan, budget planning | Sales leadership, quota setting, pipeline reviews |
A revenue projection and a marketing projection use the same underlying math as a sales projection. Only the input data changes.
The core sales projection formula
Two formulas cover most of what follows. The basic one: projected sales equals units sold times price per unit. The growth based one: previous period sales times one plus the growth rate. Every method below is a variation on one of these two ideas.
Term | Plain meaning | Why it matters |
|---|---|---|
Growth rate | The percent change between two periods of actual sales | Drives the historical method and the year over year comparison in a business plan |
Base period | The past period you are projecting forward from | A distorted base period, one quarter with a one time deal, skews everything after it |
Win rate | The share of pipeline value that historically closes | The multiplier in the stage weighted and slippage adjusted methods |
Slippage rate | The share of pipeline value that pushes past the period it was expected to close in | Ignoring it is the single biggest reason a stage weighted number runs high |
Seasonal index | A ratio describing how one period compares to the yearly average for that same period | Corrects for demand that rises or falls on a predictable calendar |
Four ways to calculate a sales projection, and which fits your pipeline
Method | Best for | Inputs needed | Formula |
|---|---|---|---|
Historical growth rate | Businesses with 6 or more months of sales history | Past period sales, growth rate | Previous period sales times one plus growth rate |
Opportunity stage weighted | Teams with an active pipeline and deal stages | Deal value and win probability per stage | Sum of each deal value times its stage probability |
Seasonal index | Businesses with a repeating demand pattern | Two or more years of same period sales | Average sales for the season times the seasonal index |
Bottom up | New businesses or new product lines with no history | Expected leads, conversion rate, average deal value | Leads times conversion rate times average deal value |
Historical growth rate method
Calculate the percent change between each pair of trailing periods, average those percentages, then multiply the most recent period by one plus that average.
Six months of sales moving from 41,200 to 52,600 dollars averages a 5 percent monthly growth rate, which projects the next period at roughly 55,200 dollars.
Opportunity stage weighted method
List every open deal with its value and the win probability tied to its stage, multiply each deal by its probability, and add the results. Most teams pull that data straight from their CRM, so what a CRM actually tracks and updates determines how clean this input is. An 8 deal pipeline worth 154,000 dollars, spread across discovery through verbal stages, weighted out to about 71,600 dollars here. The chart below breaks that same pipeline down stage by stage, total value next to weighted value.
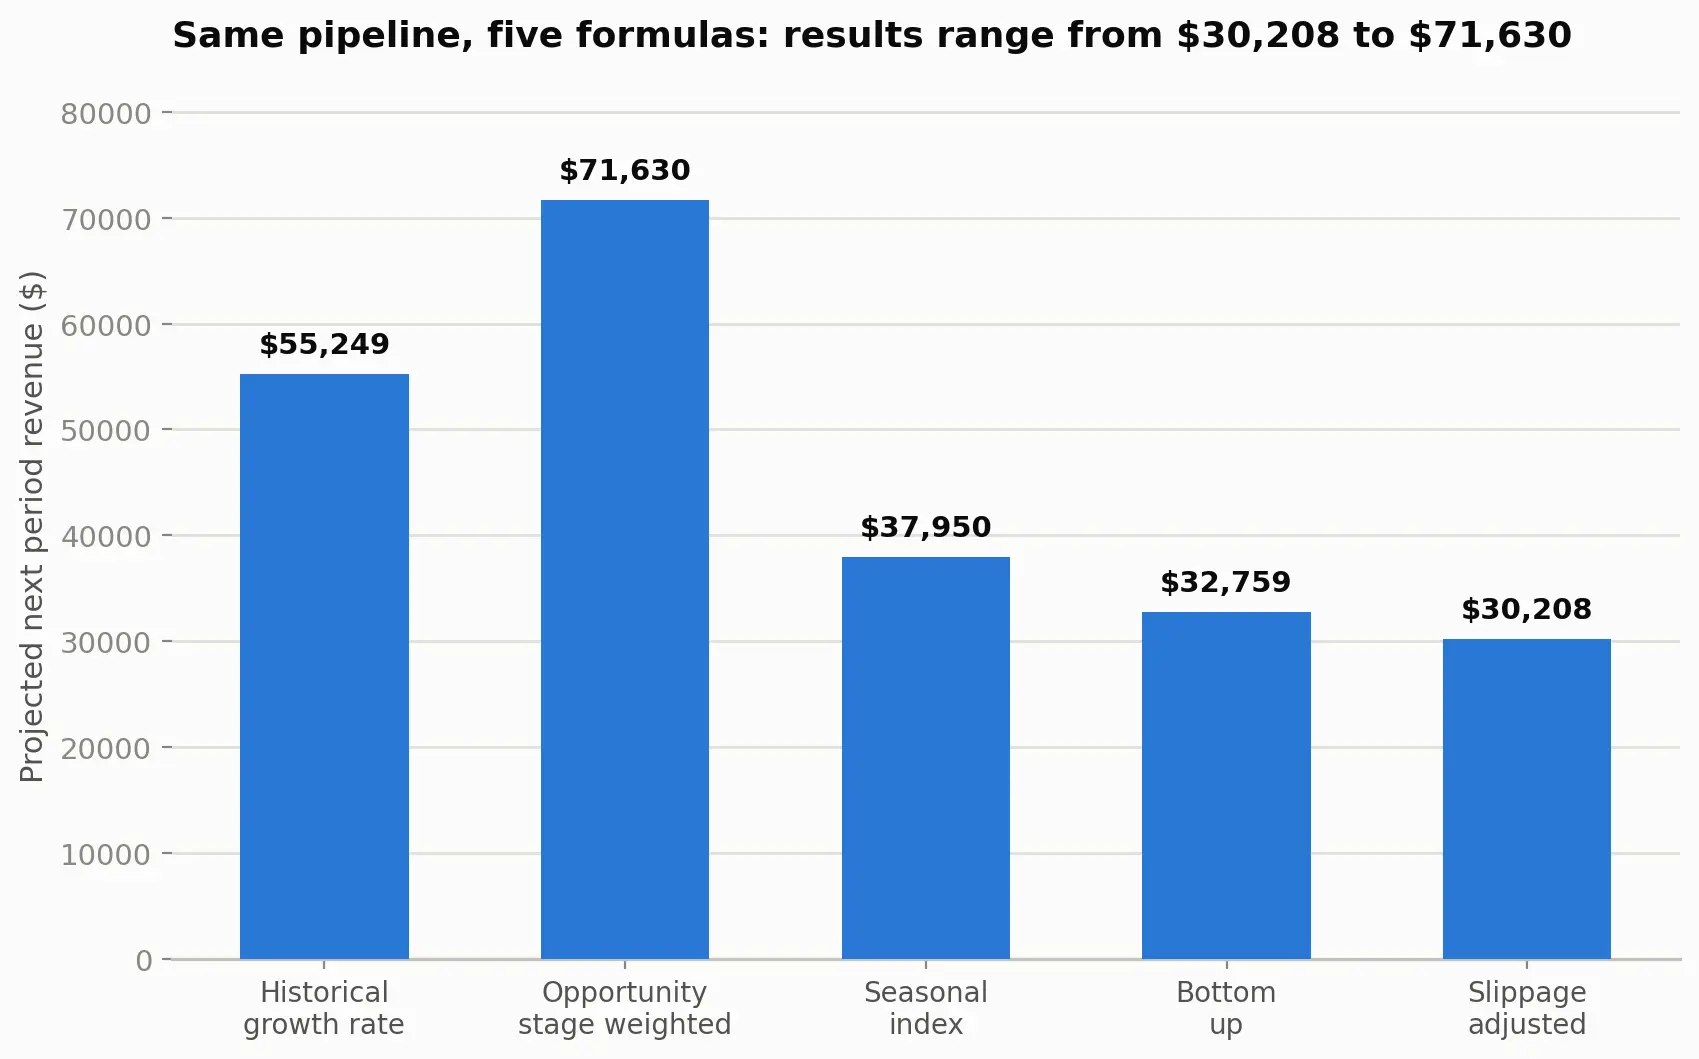
Later stages carry more weight per dollar, since a higher win probability discounts them less. That gap between total and weighted value is normal. It is not a sign the pipeline is wrong.
Seasonal index method
Average your sales for the same season across two or more prior years, then multiply by a seasonal index, a ratio that captures how that season compares to a typical one.
A business whose July runs at 92 percent of an average month multiplies its seasonal average by 0.92, not by 1.
Bottom up method
Multiply expected new leads, meaning contacts that meet your own definition of a qualified sales lead, by your lead to customer conversion rate, then by average deal value.
It is the only method here that needs no sales history, which makes it the default for a first year projection, and it tends to run lower than pipeline based methods.
That same weighting is the backbone of a full sales pipeline forecasting process, run stage by stage instead of as a single line item.
The exact formulas to copy into Excel or Google Sheets
Set up the columns first
Each formula below assumes your data sits in adjacent columns starting at row 2, with a header row at the top. Adjust the ranges to match your own sheet before pasting.
Method | What it calculates | Cell formula |
|---|---|---|
Historical growth rate | Next period projected sales | =B2*(1+C2) |
Opportunity stage weighted | Total weighted pipeline | =SUMPRODUCT(B2:B9,C2:C9) |
Seasonal index | Season adjusted projection | =B2*C2 |
Bottom up | Leads driven projection | =B2C2D2 |
Slippage adjusted | Adjusted pipeline forecast | =B2C2(1-D2)*(1-E2) |
The stage weighted formula uses SUMPRODUCT, which multiplies two ranges position by position and adds the results in one step.
That function is what makes the stage weighted formula in the table above work with two same sized ranges and no array entry.
What a modern, slippage adjusted projection formula looks like
The four classic methods above assume every dollar of weighted pipeline closes on schedule. It usually does not. A slippage adjusted version discounts the stage weighted number twice more, once for pipeline that pushes into a later period, and once for buyer indecision that stalls a deal without killing it.
Written out: pipeline value times win rate times one minus the slippage rate times one minus the indecision discount. Run against the same 154,000 dollar pipeline above, with a 29 percent win rate, a 24 percent slippage rate, and an 11 percent indecision discount, this landed at roughly 30,200 dollars, less than half the plain stage weighted result.
One pipeline run through five formulas
I took one pipeline, the same 154,000 dollars in open deals used above, and the same six months of trailing sales, and ran both through all five formulas here, using the exact cell syntax from the table earlier.
Method | Projected next period revenue |
|---|---|
Historical growth rate | 55,249 dollars |
Opportunity stage weighted | 71,630 dollars |
Seasonal index | 37,950 dollars |
Bottom up | 32,759 dollars |
Slippage adjusted | 30,208 dollars |
What the spread means for your number
The table above is easier to read as a chart once the five numbers sit side by side.
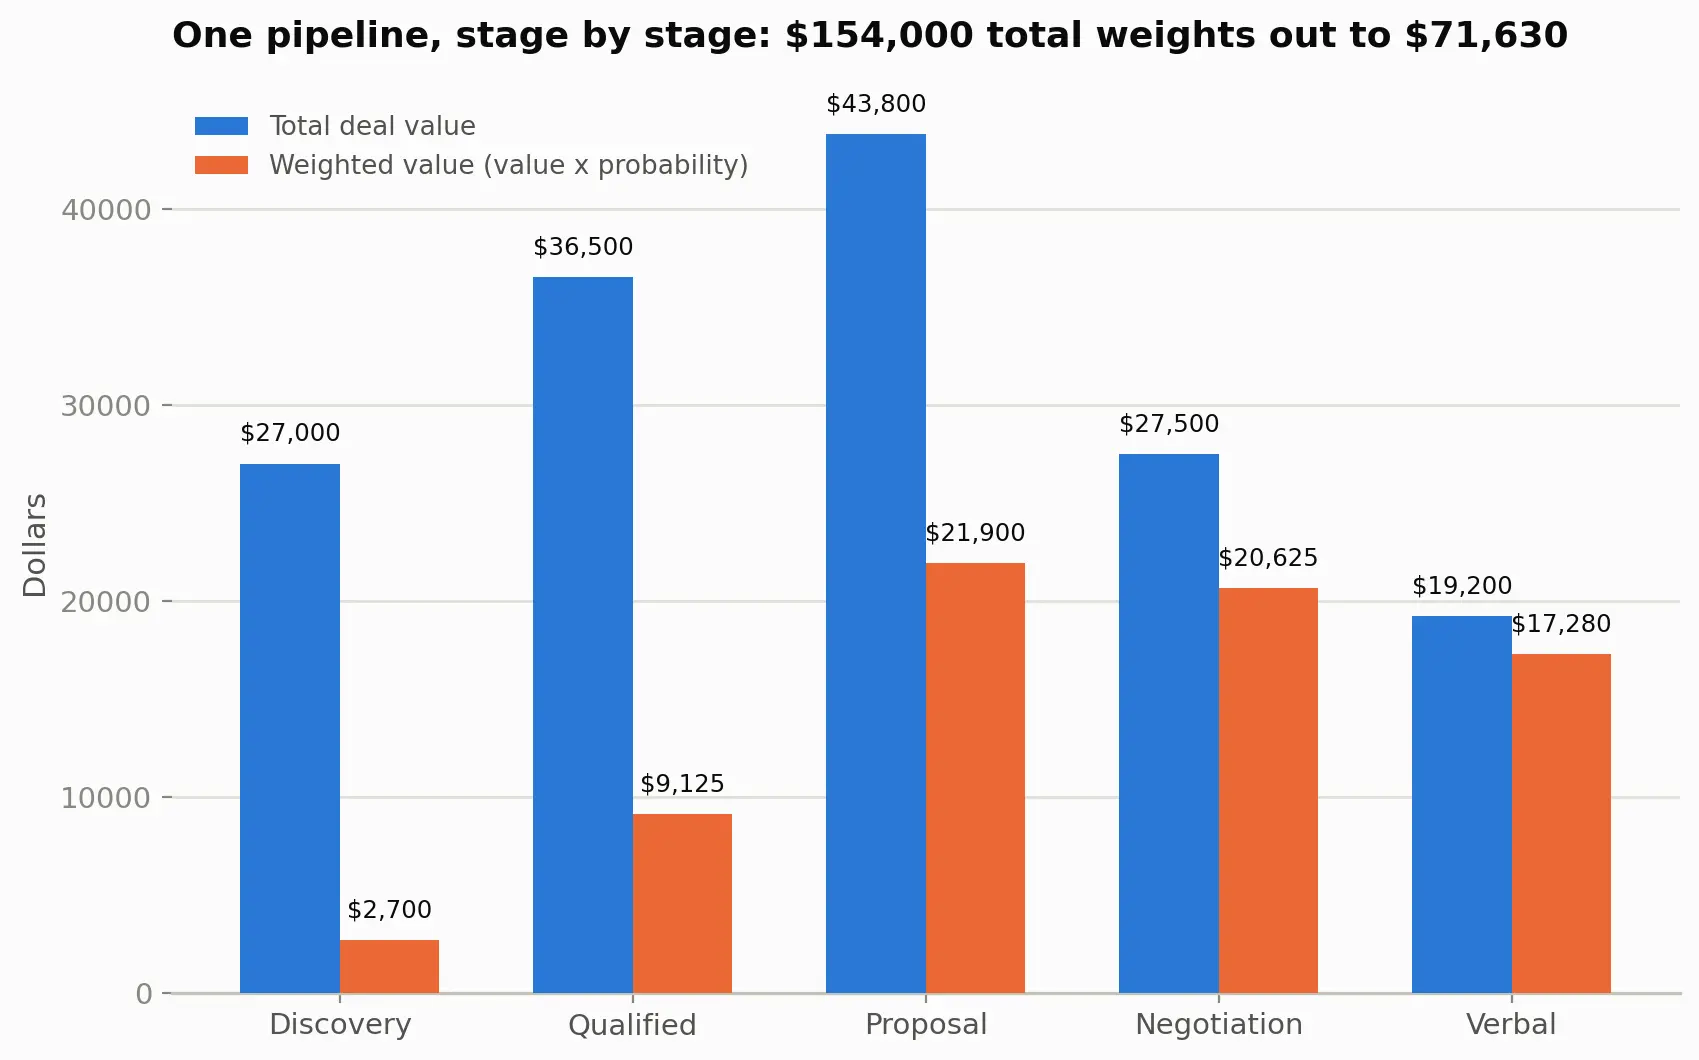
The highest and lowest results sit 41,422 dollars apart, a spread of 109 percent of the middle value. None of that spread comes from bad data.
Each formula answers a slightly different question: what pipeline is worth on paper, what it is worth once stalled deals are discounted out, or what history alone predicts with no pipeline input at all.
Picking one method and knowing what it leaves out matters more than chasing a single correct number.
The one page worksheet you can copy
Copy this into a blank sheet before your next projection pass.
Base period sales, and the growth rate from the two periods before it
Full list of open deals, with value and current stage probability for each
Trailing two years of sales for the same season, if projecting a seasonal period
Expected new leads for the period and your lead to customer conversion rate
A win rate, slippage rate, and indecision discount, all from your closed deal history
One result per method, plus a note on which one the final number is based on
Why your number will be off, and by how much
A realistic accuracy target to aim for
The industry figures already cited above put real numbers on this: most sales organizations land outside a tight accuracy band, not inside one.
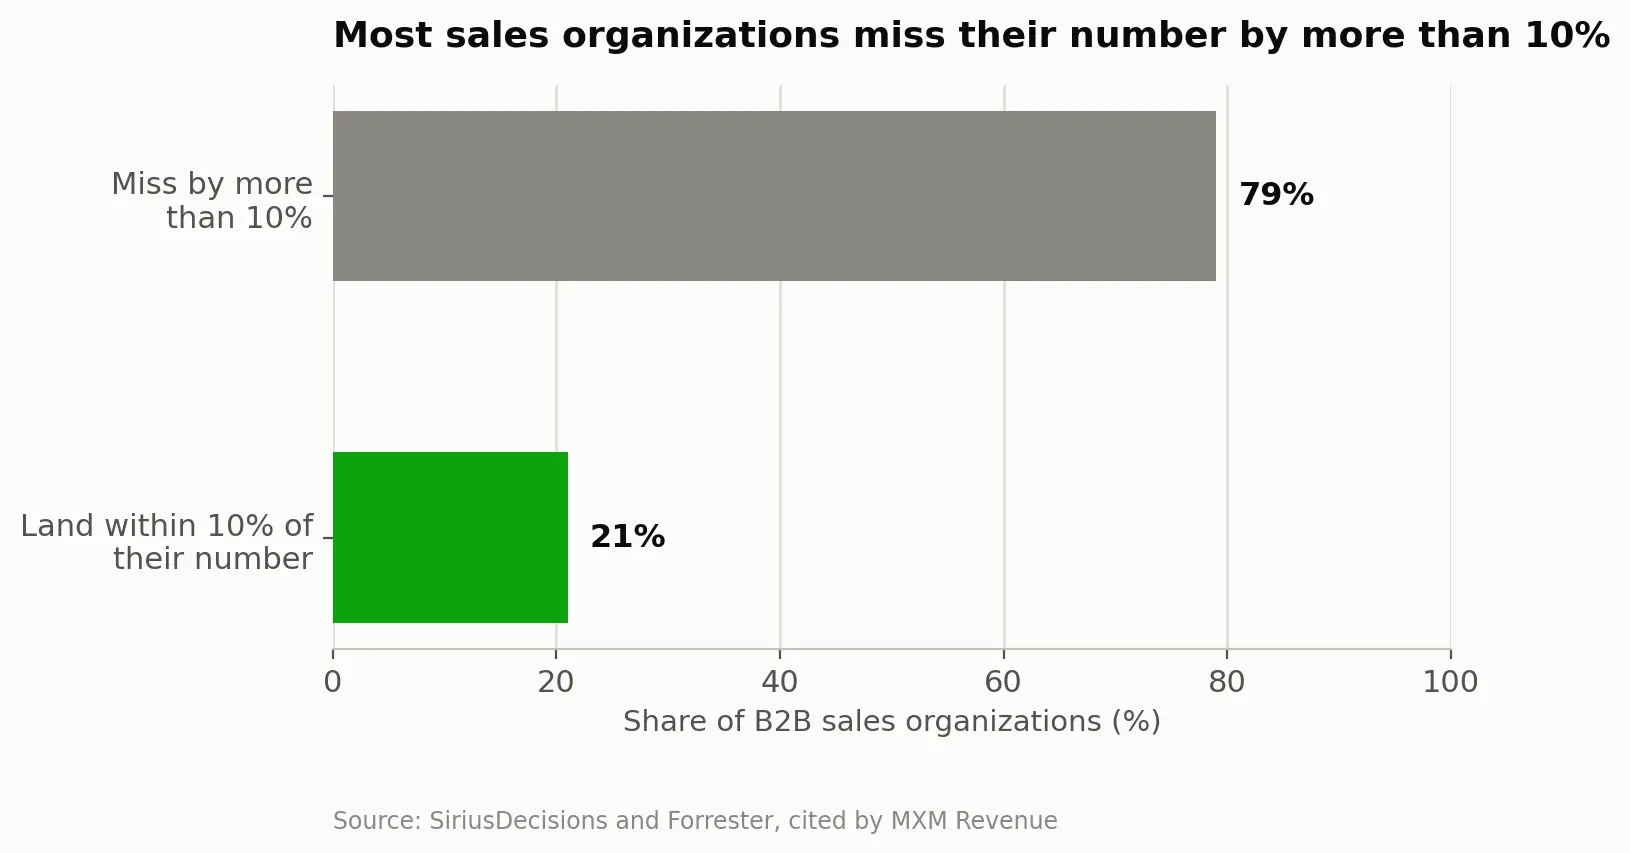
A projection within 15 to 20 percent of the actual result matches what most sales organizations experience already. Treat anything closer than that as a good outcome, and treat perfect accuracy as the wrong goal to chase in the first place.
The mistakes that make it worse
Symptom | Cause | Fix |
|---|---|---|
Projection runs far above actual results | Stage weighted method used with no slippage or indecision discount applied | Add the slippage adjusted formula as a second, lower estimate |
Projection swings wildly month to month | Growth rate calculated from only two periods instead of an average | Average the growth rate across at least four periods |
Two people on the same team get different numbers from the same pipeline | Deal stage probabilities set inconsistently across reps | Fix one probability value per stage, and stop letting reps override it |
Seasonal projection misses by a wide margin | Seasonal index built from a single prior year instead of two or more | Recalculate the index from at least two years of the same season |
A user on the Microsoft Fabric community forum ran into the second problem directly, posting a real forecast formula built from a single sales year multiplied by two adjustment values, and got help correcting it to reference an averaged range instead. The fix mirrors the growth rate averaging above.
FAQ: Sales projection formula
How often should I update my sales projection?
Update a pipeline based projection weekly or after any deal changes stage. Update a historical or seasonal projection monthly, since those depend on data that only changes once a period closes.
What tools can I calculate a sales projection with?
A spreadsheet, in Excel or Google Sheets, handles every formula in this guide. A CRM records deal stage automatically as reps update each record. Dedicated forecasting software adds scenario modeling on top of both, for teams that have outgrown a spreadsheet.
Which method is the most accurate?
None of the five is consistently most accurate on its own. Stage weighted pipeline tends to run closest for teams with clean, updated deal stages. Blending two methods and comparing results, as shown in the worked example above, usually beats trusting either one alone.
What data do I need before I start?
At minimum, a base period of past sales or a list of open deals with values attached. The stage weighted and slippage adjusted methods also need a win rate and a slippage rate, both calculated from your closed deal history, not guessed.
How can I improve projection accuracy over time?
Track the gap between each projection and its actual result, then feed that gap back into your growth rate, win rate, or slippage rate for the next period. A projection never checked against what happened never gets more accurate.
What happens if my projection turns out wrong?
Nothing breaks on its own. Record the gap, note which assumption caused it, adjust that input, and run the next period's projection with the corrected number.
What to do before your next forecast call
Pick one method from the table above that matches the data you actually have, not the one that produces the number you want to see. Build it in a spreadsheet using the exact formula, run last period's real numbers through it once as a gut check, and only then apply it going forward.
Bad input breaks every one of these methods before the formula ever gets a chance to be wrong on its own. Fix the input first, then trust the number.
Guidance and sources reviewed on August 28, 2026, against current formulas and citations.
About the author
Michael Doyle writes about B2B sales at Leaderr. He covers prospecting, cold outreach, sales data, and pipeline building, with a focus on what actually works for SDRs, founders selling on their own, and small sales teams.