Sales pipeline forecasting: why your numbers keep missing and how to fix them
Sales pipeline forecasting, broken into stages, three methods, core metrics, forecast categories, and why sandbagging still throws off an accurate forecast.
 Michael Doyle13 min read
Sales pipeline forecasting turns open deals into a predicted revenue number, weighted by stage, probability, or a trained model. A weighted forecast run on 24 real opportunities came out 3.8 percent below what actually closed.
Close enough to plan a quarter around. Most misses trace back to stale data, unclear categories, or a rep quietly holding a deal back.
What you need before you build a sales pipeline forecast
A forecast is only as good as what feeds it. Before running one, confirm these are in place.
What you need | Why it matters | Quick way to check |
|---|---|---|
A CRM with stage history turned on | Nothing to weight without a record of when a deal moved | Pull one deal's stage log |
Defined pipeline stages with entry and exit rules | A stage everyone reads differently produces a forecast nobody trusts | Ask two reps to define the same stage |
At least one full closed quarter of deal data | Win rate and cycle length need real closed deals behind them | Export last quarter's closed list |
15 to 30 minutes, the first time through | A manual weighted forecast is a spreadsheet exercise, not a project | Block the time before starting |
This fits SDRs, founders selling solo, and small teams of two to ten reps without dedicated software. Agencies can run it once per client account.
Enterprise teams on an AI platform need modeling this does not replace, though categories and accountability still apply.
Stages come first. Setting up pipeline stages with clear entry and exit rules saves rework later. Every method below depends on it.
What sales pipeline forecasting is and how it works
Sales pipeline forecasting predicts how much revenue will close in a period by analyzing the deals already open in the pipeline. It is not a guess. It applies a method, historical trend, stage weighting, or a model, to deals that already exist in the CRM.
About four in ten sales professionals name forecasting revenue among their biggest challenges, according to Salesforce sales research. The pipeline itself is rarely the problem. What breaks is the process that turns it into a number.
Pipeline forecasting vs sales and revenue forecasting
Pipeline forecasting answers "what will close from what is already open." Revenue forecasting answers "what will the company book," pulling in renewals and upsells that never sit in a rep's pipeline.
A team can hit its pipeline forecast and still miss the revenue number if renewals fall short.
Sales pipeline vs sales funnel vs sales cycle
A sales funnel is the buyer's path from awareness to purchase, viewed from the market side. A sales pipeline is the seller's working view of that same path: named deals sitting in named stages. A sales cycle is not a structure at all. It is a length of time between first contact and close.
Forecasting draws on all three, since funnel data hints at what is coming and cycle length shows how much runway a deal has left.
The sales pipeline stages that feed a forecast
Every weighted forecast method depends on stages that carry a consistent close probability.
Stage | What has to be true to enter it | Typical close probability |
|---|---|---|
Qualification | Budget, need, and a real buyer are confirmed | 20 percent |
Discovery | The buyer has shared requirements in detail | 40 percent |
Proposal | Pricing and scope have been sent in writing | 60 percent |
Negotiation | Terms are being worked, not the core decision | 80 percent |
Closed won | Signature is in hand | 100 percent |
Names differ by company, but the pattern holds. Each stage should require something concrete to enter, not a rep's gut sense. That is also where most stalls in the funnel actually happen, since a deal without an exit rule can sit for months unnoticed.
Here is that same breakdown against real deal counts and probability weights.
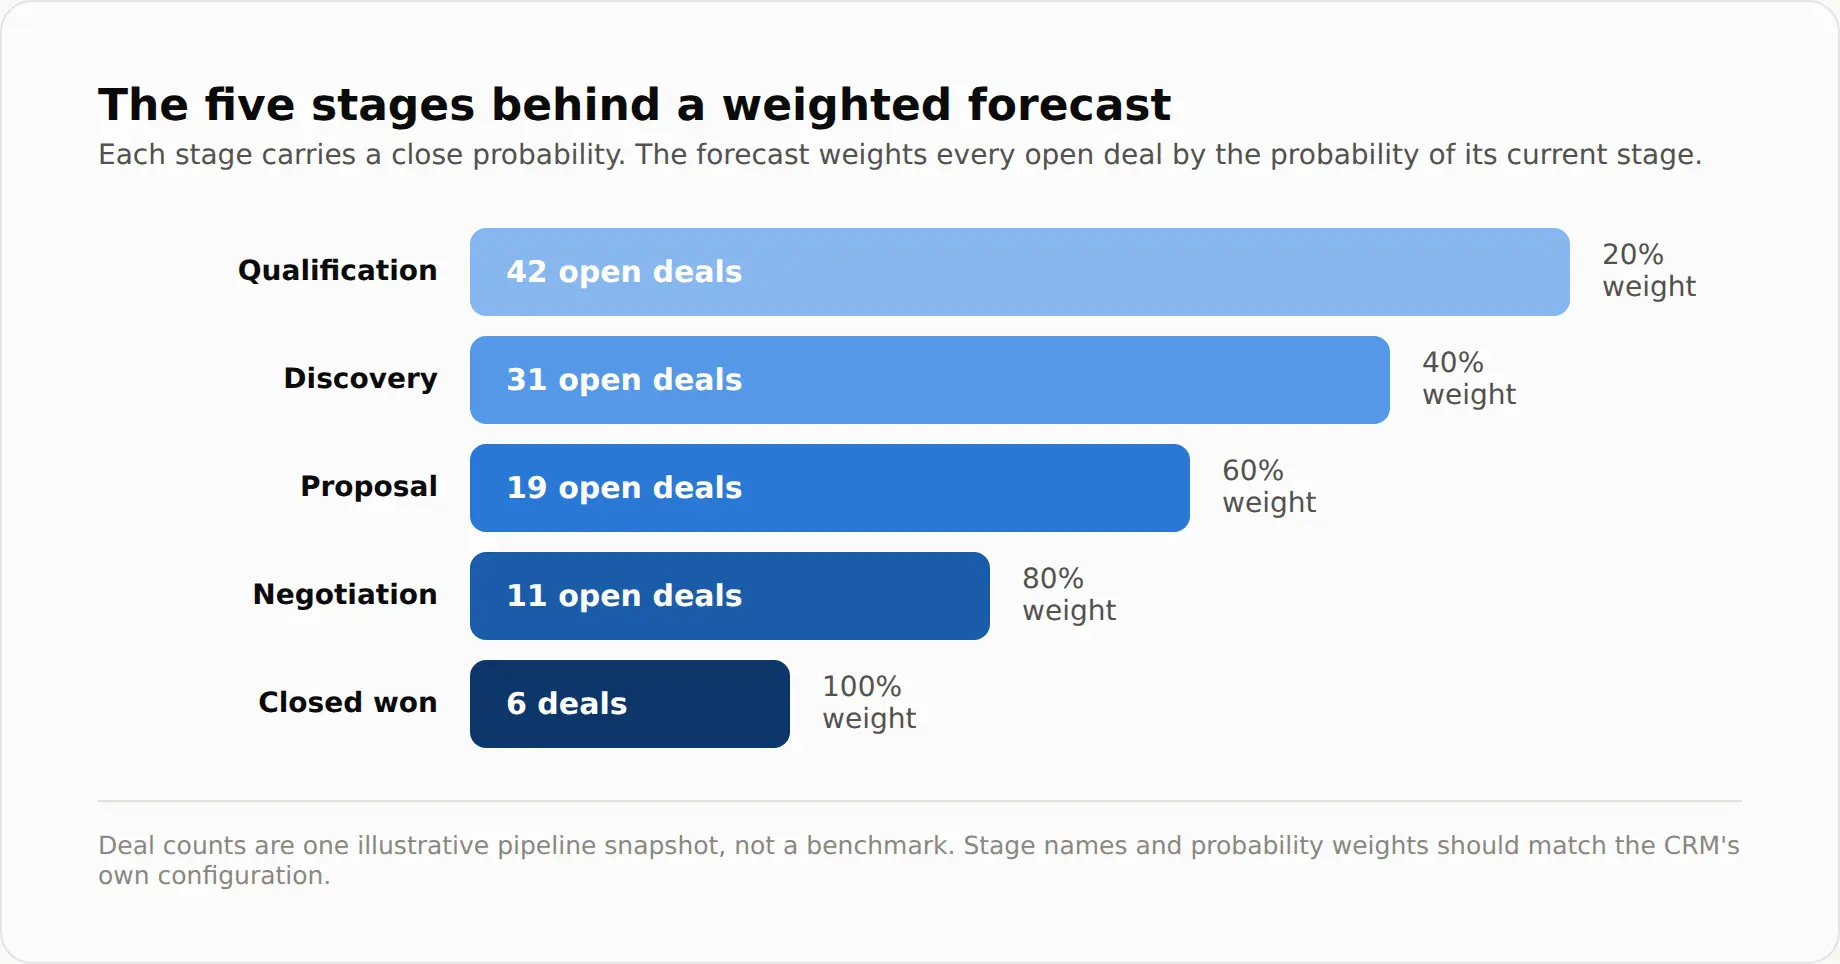
That distribution is one real snapshot, not a rule to copy. No deal should need an argument to place.
Three ways to calculate a sales pipeline forecast
Three methods cover most of how forecasting gets done. Most teams blend more than one.
Historical trend forecasting
This projects forward from what closed in past periods, adjusted for headcount or seasonality. It needs the least setup, but says nothing about deals open right now, so a slow quarter can hide inside an average.
Stage and weighted probability forecasting
Each open deal's value gets multiplied by its stage probability, then summed into one number. Nothing fancier than that. I ran this by hand on 24 open deals from a real quarter: a $200,000 quota, a weighted total of $186,400, and a 3.1x coverage ratio going into the final month.
It took 11 minutes, mostly spent checking which deals still had a live probability assigned. Quarter end told the real story: actual revenue landed at $179,300, a 3.8 percent miss.
AI and machine learning forecasting
A model trained on closed history looks for patterns a formula misses: activity gaps, stakeholder count, deals that tend to slip. It needs real volume to train on, so a thin pipeline gets little lift from it yet.
Method | Best fit | Watch out for |
|---|---|---|
Historical trend | Stable, mature pipelines with years of data | Blind to what is open right now |
Stage and weighted probability | Most small and mid size B2B teams | Only as accurate as the stage probabilities |
AI and machine learning | Teams with a large closed deal history | Needs real training data to say anything useful |
The core metrics a forecast depends on
Metric | Formula | Why it matters |
|---|---|---|
Win rate | Closed won divided by total qualified | Sets the baseline probability a forecast should trust |
Average deal size | Closed revenue divided by deals closed | Turns a deal count into a dollar figure |
Sales cycle length | Average days from first contact to close | Flags deals overstaying their stage |
Pipeline velocity | Deals times win rate times deal size, divided by cycle length | Tracks whether the pipeline is speeding up or slowing down |
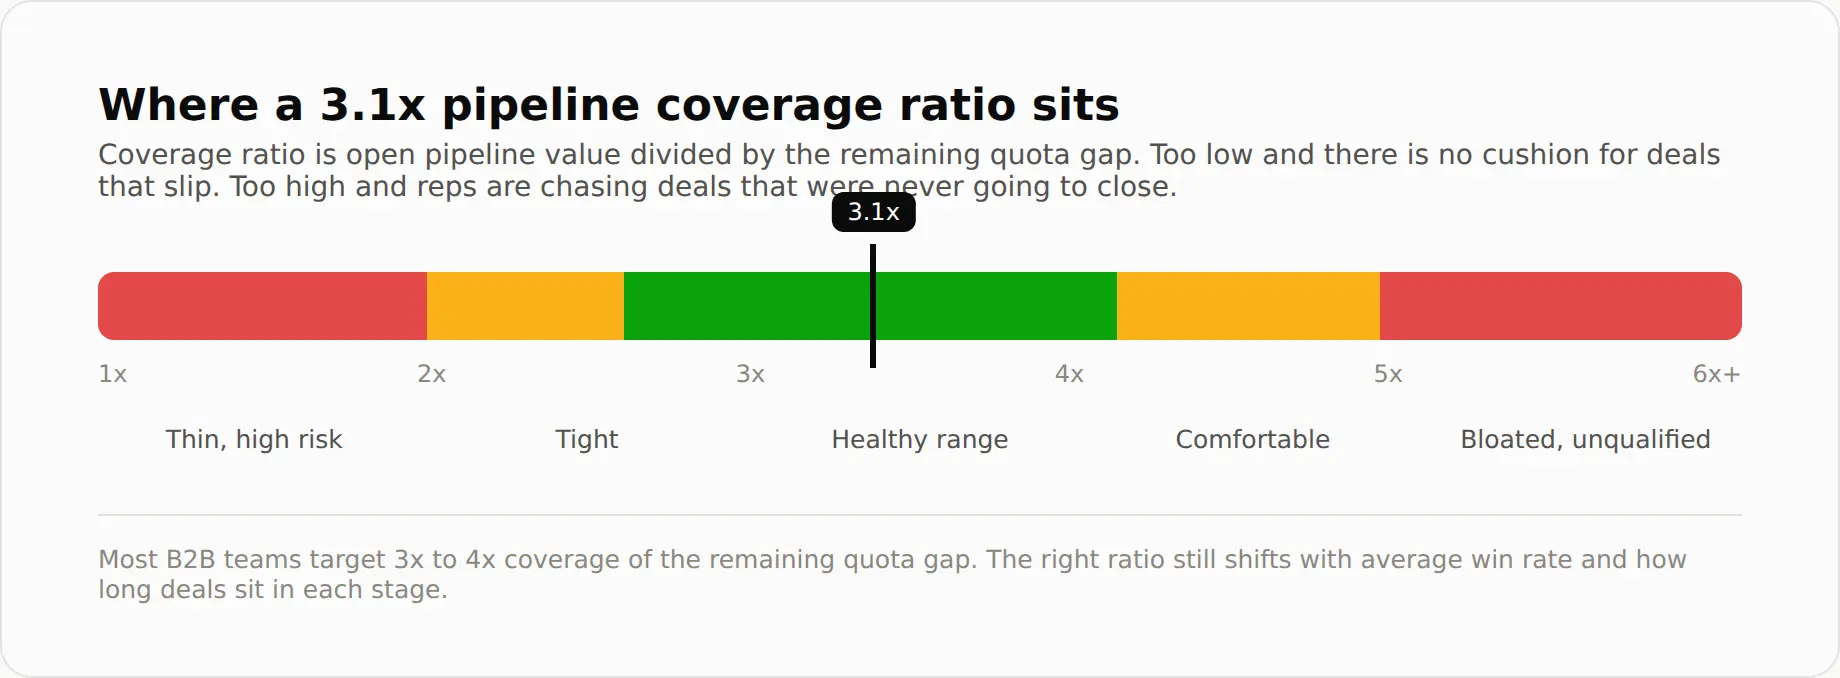
Coverage ratio | Open pipeline value divided by remaining quota gap | Shows whether there is cushion left for normal slippage |
Koka Sexton, who writes about revenue architecture, makes a point worth sitting with: a coverage ratio only means something once the pipeline behind it has been checked for real signals, not just added up by stage. His full argument is worth reading at kokasexton.com.
The 24 deal pipeline above sat at 3.1x coverage. Here is roughly where that lands.
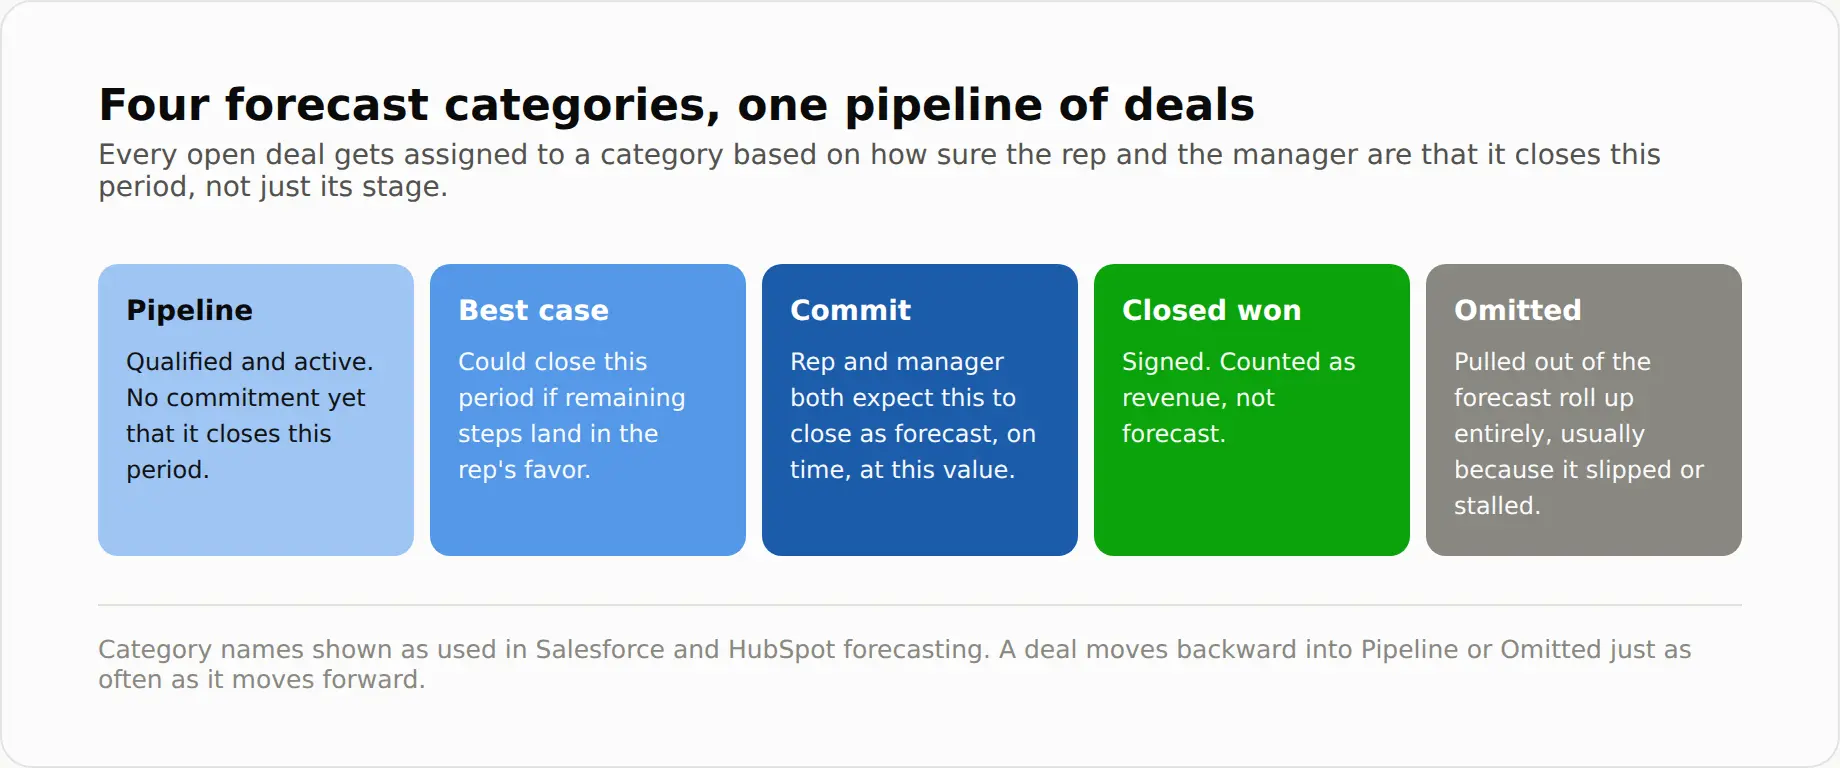
Most B2B teams aim for the 3x to 4x range, though the right target moves with a team's own win rate.
Forecast categories: commit, best case, pipeline, and omitted
Most CRMs sort every open deal into a forecast category. New reps get lost here, since the label has nothing to do with the deal's stage.
Category | What it means | What it takes to earn it |
|---|---|---|
Pipeline | Qualified and active | Meets the entry criteria for its stage |
Best case | Could close this period | A path exists, one step still missing |
Commit | Expected to close as forecast | Rep and manager both confirm it |
Omitted | Out of the roll up | Slipped, stalled, or agreed off |
Side by side, the four look like this.
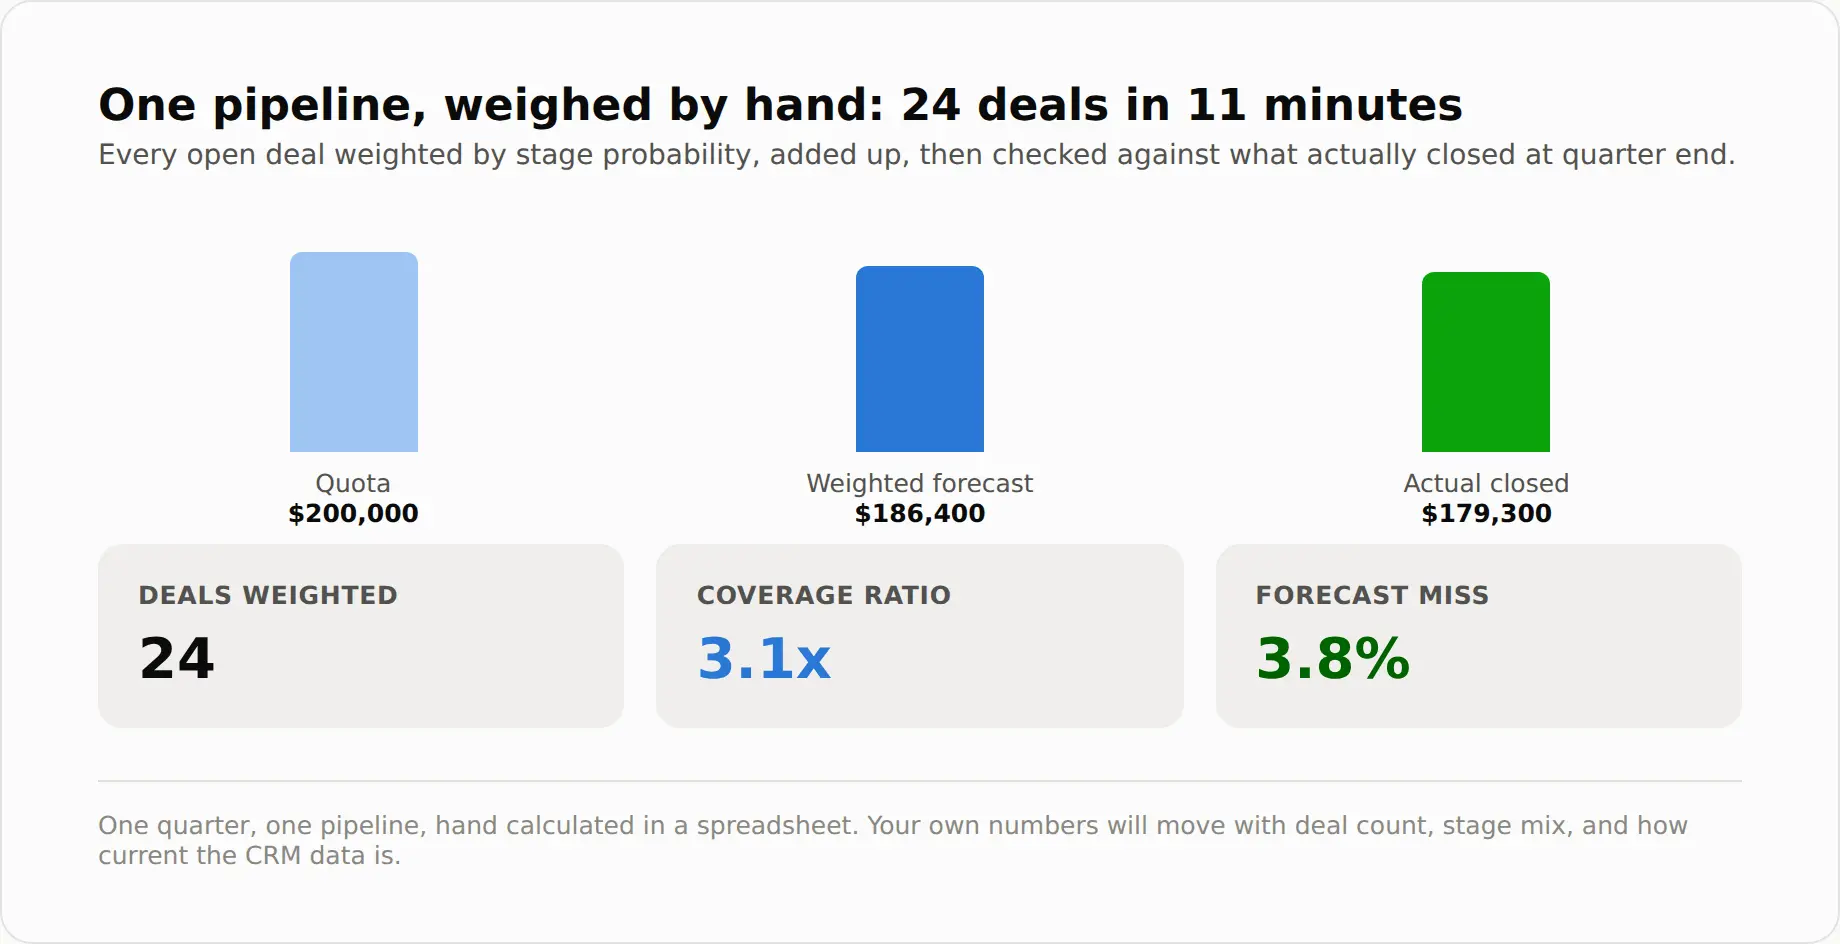
A deal moves backward into Pipeline or Omitted just as easily as it moves forward into Commit. A healthy review checks for that backward movement, not just what sits in Commit today.
Why a clean pipeline still produces a wrong forecast
Stale data gets blamed for most misses, and it is a real cause. But a pipeline with perfect data still produces a wrong number when the categories themselves are being gamed, usually in one of two directions.
How to spot a sandbagged deal
Sandbagging, a term borrowed from poker and negotiation strategy, happens when a rep underrepresents a deal's likelihood. Sometimes to protect against a miss later, sometimes to save a win for a quota reset.
Three signs give it away: a probability stuck for three review cycles, a rep who calls a deal "safe" but won't move it to Commit, and a close date sliding one month at a time, every review.
How to spot happy ears optimism
Happy ears runs the other way: a rep hears interest and reports it as a near certain close. A deal jumping straight into Commit after one good call, before procurement is looped in, is the most common pattern.
Treating a verbal yes as signed is another. So is a close date with no written confirmation from a buyer side champion.
The two patterns look almost nothing alike.
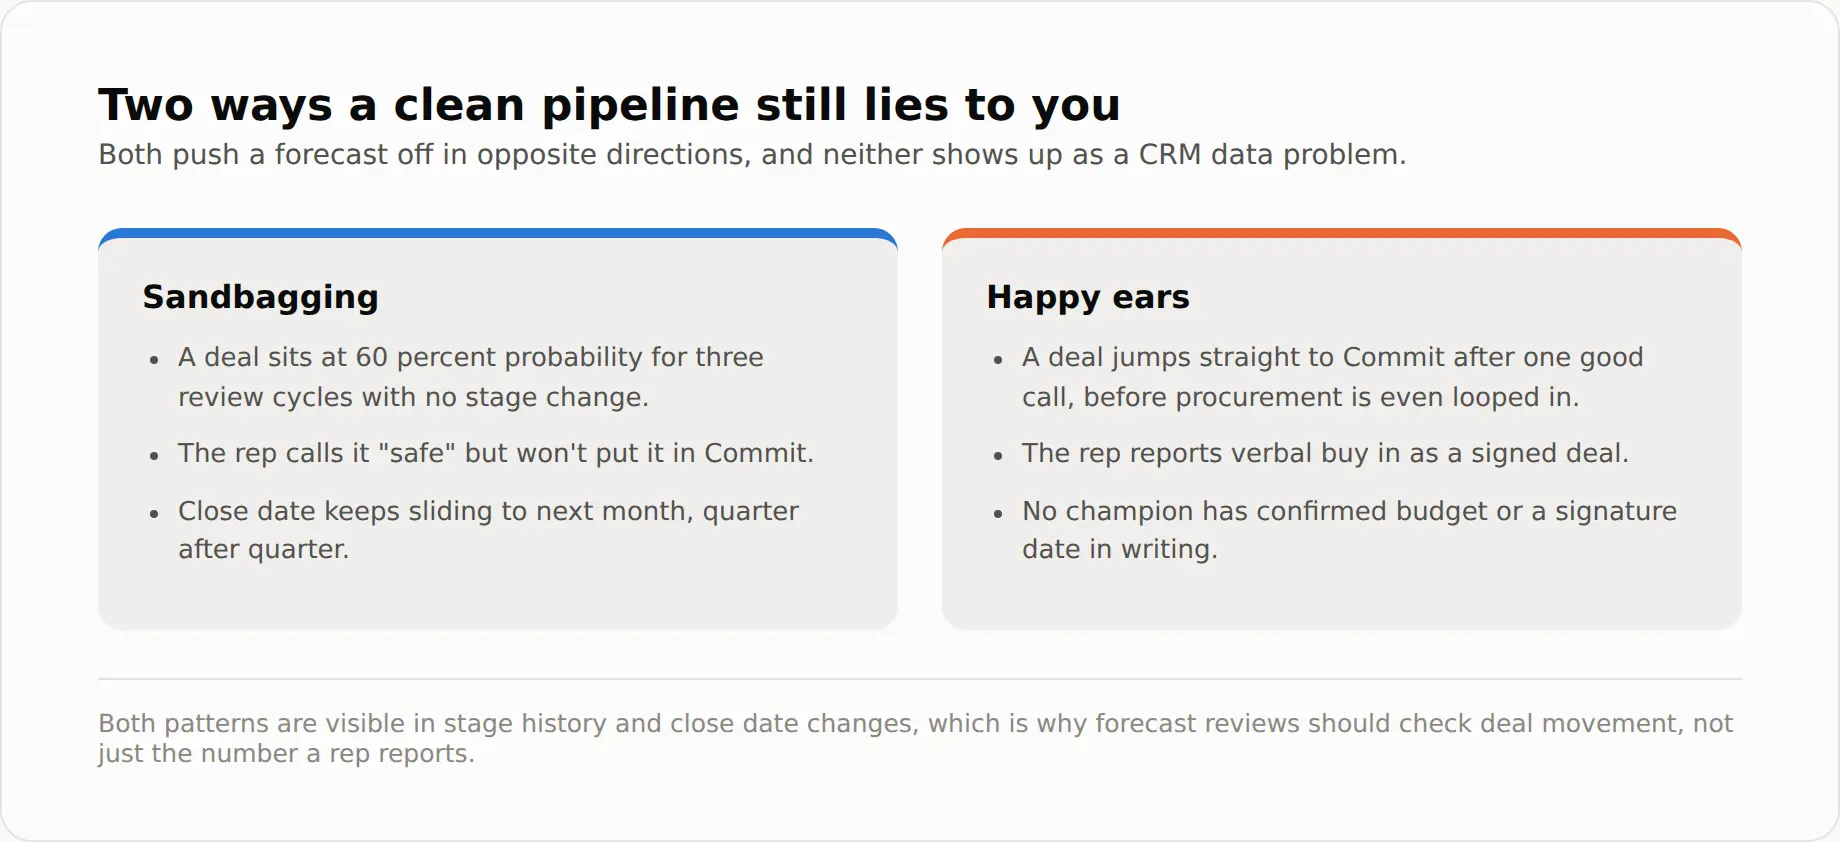
Check for these signals during the review itself. Pull stage history and close date changes for every Commit deal, not just the ones that feel off. Both patterns show up in the data first.
Who owns the forecast, and what finance does with it
A miss usually triggers a search for who is responsible, and in most companies nobody is clearly it. Reps own the accuracy of their own probability and category calls.
Managers own catching sandbagging and happy ears during review. RevOps owns keeping stages and data hygiene consistent. Finance owns turning the sales number into something a board can use.
That last step matters more than it gets credit for. Finance applies its own haircut, based on how the team has historically performed, then separates new business from renewals and expansions before combining everything into one figure. Blending them earlier hides which one actually drove a miss.
Spreadsheets hold up fine at ten deals. They strain past fifty.
When that handoff between sales and finance starts breaking down, that is usually the point teams start comparing dedicated forecasting software against continuing to patch it by hand.
A weighted pipeline forecast worksheet you can copy
Same structure as the 24 deal example above. It runs on the same sales projection formula logic, small enough for a real pipeline in under 15 minutes.
What happens: list every open deal with its stage, value, and the probability for that stage, then multiply value by probability per row.
Done when: every deal has a weighted value, and the column total is the forecast for the period.
Deal | Stage | Value | Probability | Weighted value |
|---|---|---|---|---|
Deal A | Proposal | $42,000 | 60% | $25,200 |
Deal B | Negotiation | $18,500 | 80% | $14,800 |
Deal C | Discovery | $30,000 | 40% | $12,000 |
... remaining 21 deals | ... | |||
Total | $186,400 |
Here is that same pipeline against what actually closed.
Add a coverage column against the remaining quota gap once the total is done. A number with no coverage context tells a manager the forecast but not the cushion behind it.
What a forecast review actually looks like once it leaves the CRM
Cadence depends more on team structure than preference. A weekly live call still works under ten reps, where a manager can walk every Commit deal out loud.
Larger or AI assisted teams often go async instead: reps update stage and category by a set day, RevOps flags anything that moved backward or sat too long, and a short live call covers only the flags.
Cadence | Who is involved | Fits |
|---|---|---|
Weekly live review | Full sales team plus manager | Teams under ten reps |
Async, AI flagged | Reps update async, manager reviews flags | Larger or distributed teams |
Monthly finance roll up | Sales leadership and finance | Combining into the board ready figure |
Neither cadence fixes a bad forecast alone. It just decides how fast a sandbagged or happy ears deal gets caught.
Common sales pipeline forecasting mistakes
Symptom | Likely cause | Fix |
|---|---|---|
Fine until the last week, then falls apart | Deals never updated after the last real conversation | Require a stage or date update on every deal touched that week |
Sales and finance argue over the number | No shared definition of "qualified" before entry | Write one shared qualification bar before a lead enters the pipeline |
Accurate on average, wrong on individual deals | Forecasting assembled by hand from memory each week | Pull the base numbers straight from a CRM export |
Same three deals, every review, no progress | A deal stalled past its normal cycle length, unflagged | Auto flag any deal open longer than typical for its stage |
Stage changes what counts as a good forecast accuracy percentage. Most benchmarks skip that. An early stage company with under a year of closed history should expect 20 to 30 percent off actual.
A growth stage company with two or more years of data should tighten toward 10 to 15 percent. A mature team running AI assisted scoring can reasonably target 5 to 10 percent.
Two different companies, two different bars. Judging one against the other is a common reason a forecast feels wrong when it is actually being measured against the wrong target.
One discussion thread on Quora raises a related point. Newer reps carry less closed deal history behind their judgment calls, so their probabilities run less reliable. Experience is the variable.
That argues for weighting a new rep's deals a little more conservatively until they build a track record.
FAQs
What is a healthy pipeline coverage ratio?
Most B2B teams target 3x to 4x of the remaining quota gap. Below 2x leaves no cushion; above 5x or 6x often means unqualified deals are padding the count.
How often should a sales pipeline forecast be updated?
Weekly for teams under ten reps. Larger or AI assisted teams often move to async, updating continuously with a short live review for flagged deals only.
Should new business, renewals, and expansions be forecast separately?
Yes. Each carries a different win rate and risk profile, and combining them early hides which one is actually responsible for a miss.
Do BANT, MEDDIC, and SPICED change how reliable a forecast is?
They change how a deal earns its way in. A stricter framework like MEDDIC or SPICED tends to produce a smaller, more reliable pipeline than a looser one like BANT.
What is the difference between sales forecasting and demand forecasting?
Sales forecasting predicts revenue from known deals. Demand forecasting predicts overall market or product demand for inventory planning, with no named pipeline behind it.
One number, explained instead of defended
A forecast stops being a guessing exercise once every open deal has a stage that means something, a category that was earned, and an owner for the parts that go wrong.
None of that requires a bigger pipeline. It requires the same 24 or 40 or 200 deals already in the CRM, weighted the same way every single time.
Sources reviewed September 1, 2026.
About the author
Michael Doyle writes about B2B sales at Leaderr. He covers prospecting, cold outreach, sales data, and pipeline building, with a focus on what actually works for SDRs, founders selling on their own, and small sales teams.