

Firmographic data is a set of facts that describe a company rather than a person, things like industry, employee count, revenue band, location, and ownership type. B2B teams use it to decide which companies are structurally worth pursuing before a single contact ever gets called or emailed.
This guide covers what counts as firmographic data, how it differs from technographic and demographic data, where the data actually comes from, and a four stage process for turning a raw list of companies into a shortlist worth calling.
It does not cover which data vendor to buy from or how to write the outreach message itself; those are separate decisions. You do not need special software to follow along. A spreadsheet and a sample list of twenty to forty of your own accounts is enough to try the scoring approach below.
Firmographic data examples
Firmographic data breaks down into a handful of recurring fields. Most B2B databases and CRMs center on the same core points:
Industry classification, often tagged with a NAICS or SIC code
Company size, usually counted by employee headcount
Annual revenue, reported as a band rather than an exact figure
Headquarters location and the countries or regions a company operates in
Ownership structure: public, private, subsidiary, or nonprofit
Years in operation or founding year
Funding stage and most recent funding round, for venture backed companies
Growth signals such as recent hiring, layoffs, or leadership changes
Industry codes are worth a note on their own. NAICS replaced the older SIC system as the federal standard for classifying businesses in 1997, and most modern B2B databases still carry both codes because some legacy tools and government contracts still key off SIC.
None of these fields describe a person. That is the line that separates firmographic data from demographic data, and it matters because a company with the right firmographic profile can still have zero people in it worth calling this quarter.
Firmographic segmentation
Firmographic segmentation is the process of grouping companies by shared firmographic traits so a sales or marketing team can treat similar accounts the same way. A vendor selling procurement software to five person startups and five thousand person enterprises with the same message wastes both audiences.
A typical segmentation exercise picks three to five fields, industry plus employee band plus geography is a common starting point, then splits the total addressable market (TAM) into three to six groups. Fewer than three groups usually is not worth building separate campaigns for. More than eight groups usually means the groups overlap and nobody on the team can tell them apart anymore.
The term itself traces back to industrial market segmentation research from the 1970s and 1980s. Shapiro and Bonoma's 1984 nested approach to organizational buying behavior is generally credited with popularizing the idea of firms segmenting other firms the way consumer marketers segment people, according to the term's background on Wikipedia.
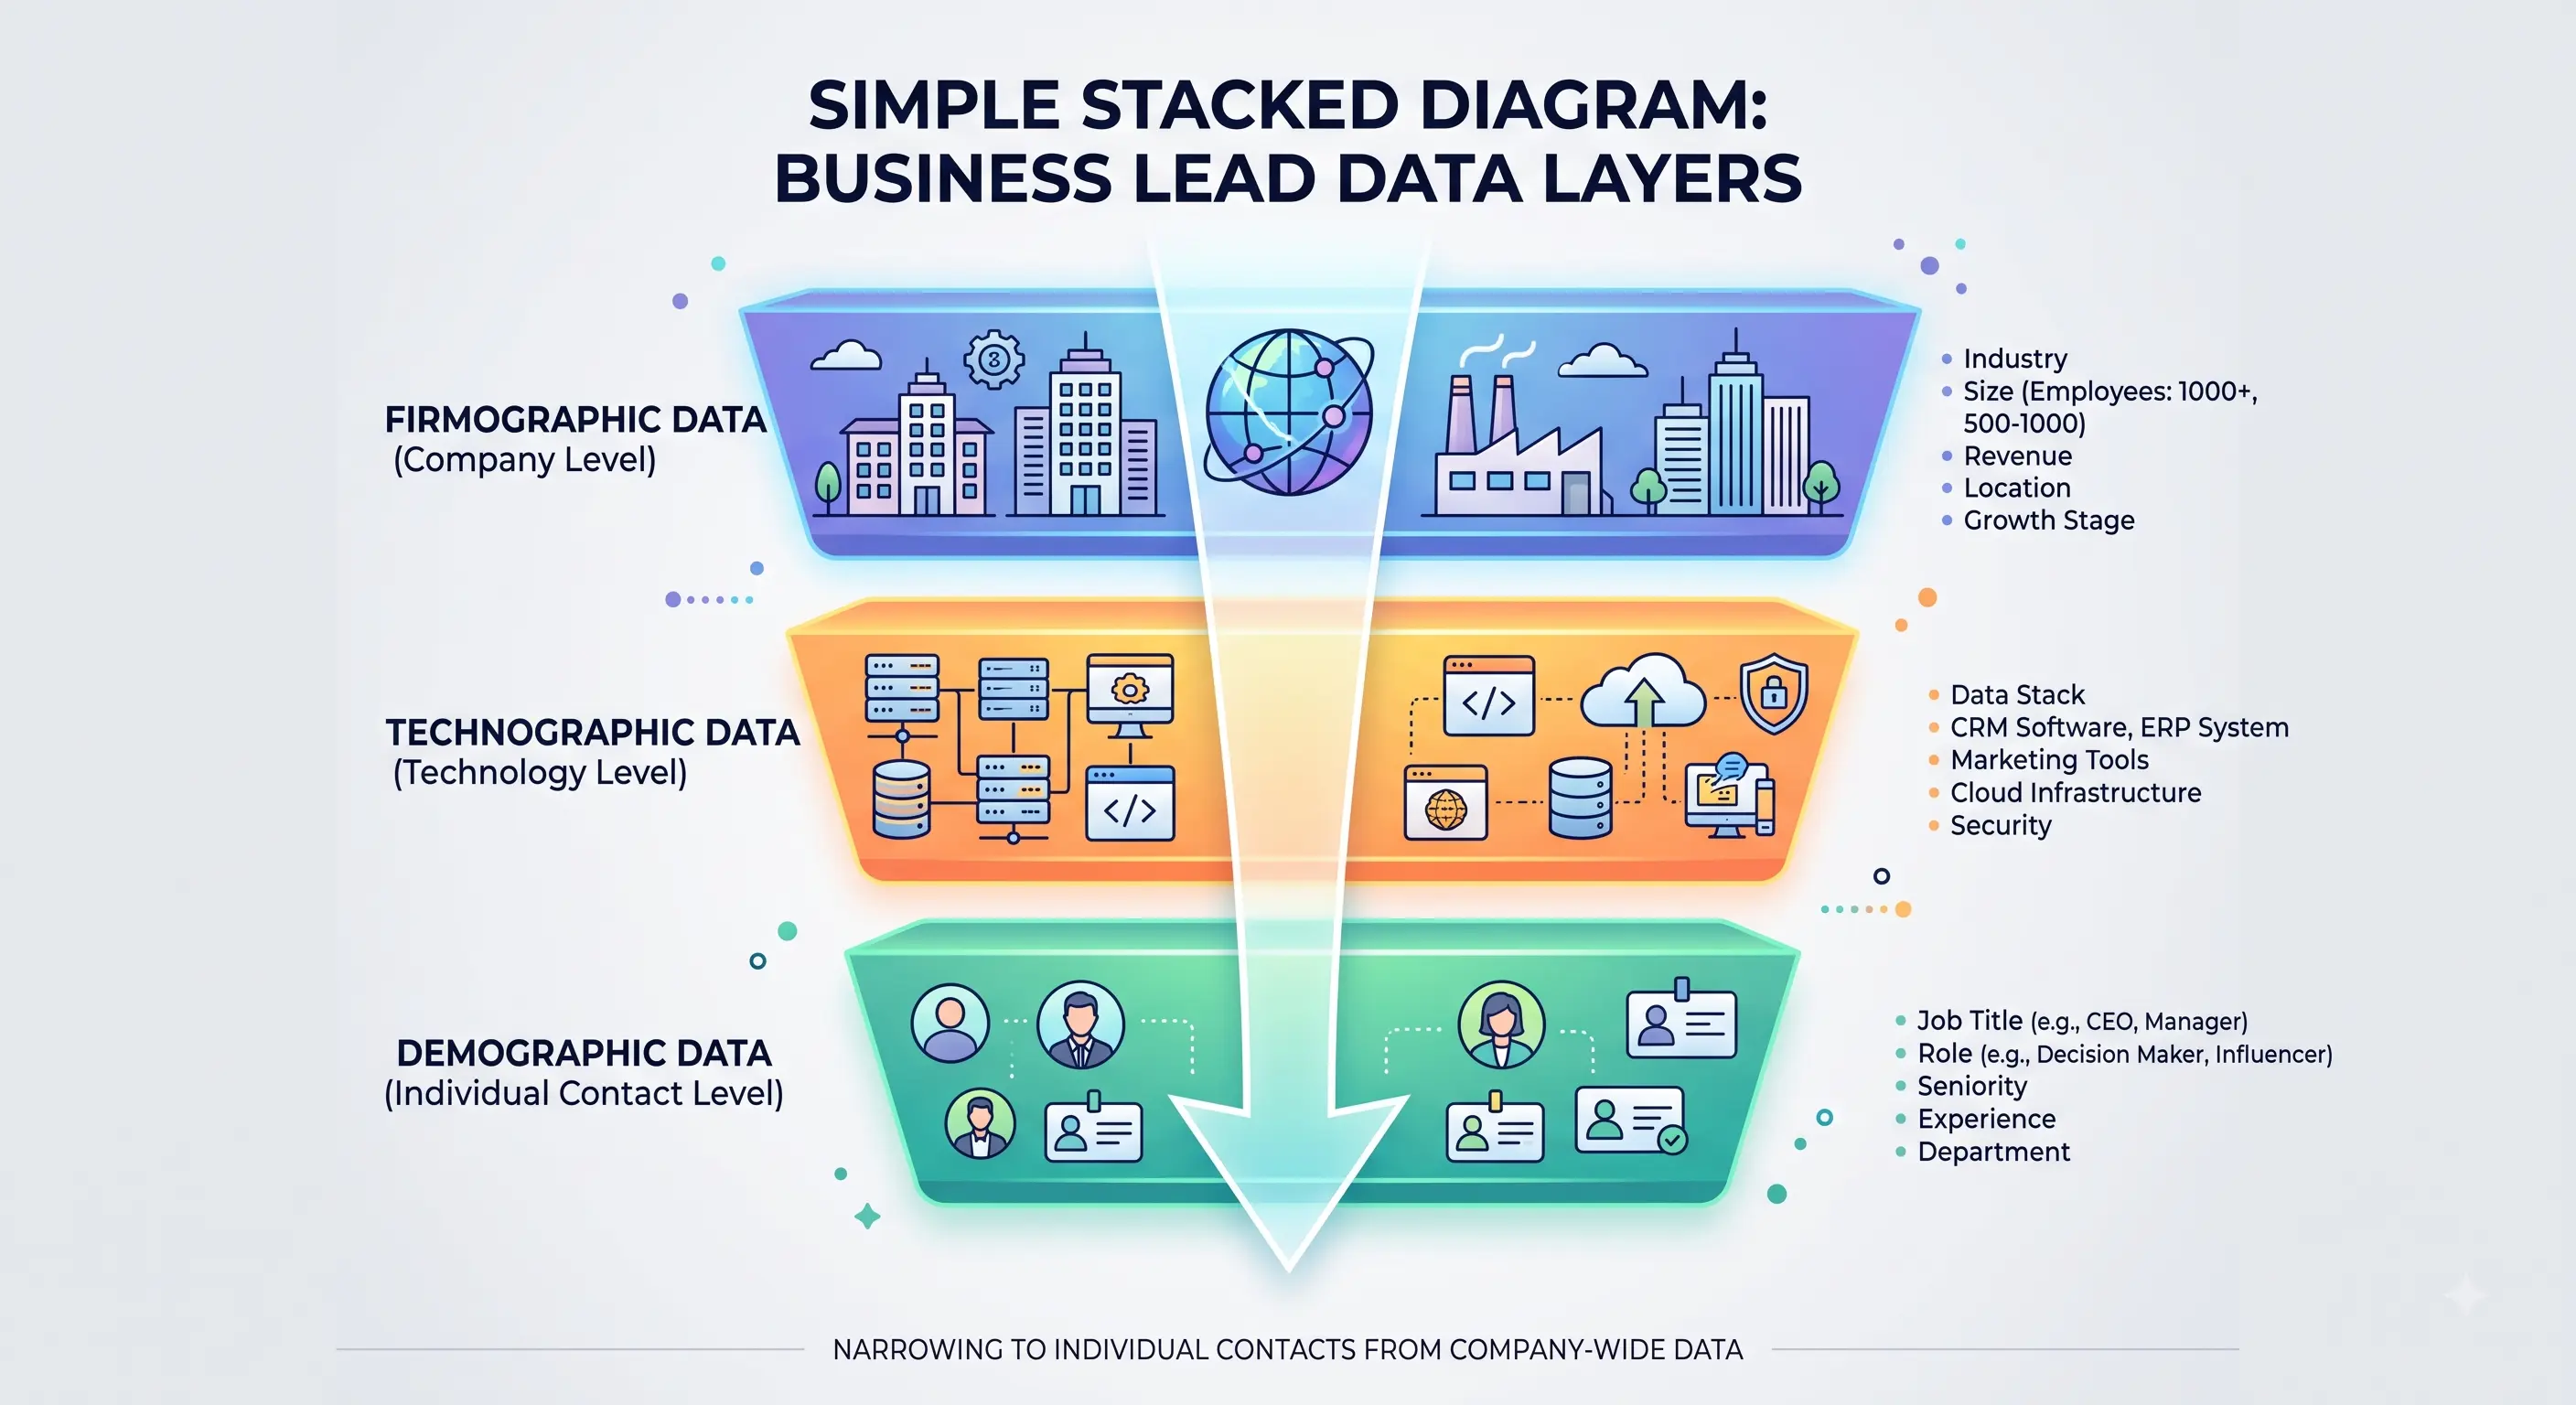
Firmographic data vs technographic data vs demographic data
These three data types answer different questions, and B2B teams tend to need all three at different points in the funnel.
Data type | What it describes | Example fields | Answers |
|---|---|---|---|
Firmographic | The company as a whole | Industry, headcount, revenue band, location | Which companies are structurally worth targeting |
Technographic | The software a company runs | CRM platform, hosting provider, analytics tools | Which companies already use tools your product integrates with or replaces |
Demographic | The individual person | Job title, seniority, department | Which person inside a qualified company to actually contact |
Firmographic data qualifies the account. Demographic data picks the contact inside that account. Technographic data is optional context that sharpens the pitch once both of those are settled.
A company can score perfectly on firmographics and still be a poor fit if nobody in the target department has decision making authority, which is exactly why the three layers stack rather than replace each other.
Technographic and demographic data are two more terms that often get grouped alongside firmographics; a fuller breakdown of b2b sales terms that come up in real deals covers the rest.
Where firmographic data actually comes from
Firmographic data comes from three broad sources, and most working lists blend all three.
Public records make up the free layer: government business registries, filings for public companies, and a company's own website and job postings. This is slow to pull together by hand but costs nothing beyond time.
Third party data providers aggregate, verify, and refresh firmographic records at scale, then sell access through a subscription or per record credit. Coverage and refresh cadence vary widely between providers, so match rate on your own list matters more than a vendor's advertised database size. This layer is one piece of the broader B2B data enrichment process, which also covers contact and technographic fields.
First party collection fills in what public and third party sources miss: a signup form field, a sales call note, a CRM field a rep updates by hand. It is the smallest source by volume and the most accurate, because it came straight from the company.
Tools built for company lookups, such as leaderr.io's domain search, return a slice of these firmographic fields, industry, size, and location, for a single company entered by domain.
None of these sources stay accurate forever. A company's headcount and revenue band move as it grows, and a stale firmographic record can put a company in the wrong segment for months before anyone notices.
Putting firmographic data to work
Four stages take a raw account list from unscored to actionable.
Stage 1: Define your ideal customer profile
What happens: Look at your best closed won accounts from the last twelve months and write down the firmographic traits they share. Industry, employee band, revenue band, and region are the usual starting four. This becomes your ideal customer profile (ICP), the firmographic description of who you sell to best. Skip guessing at this stage. Pull the actual list of accounts and read the pattern off it.
Done when: You have four to six firmographic traits, each backed by a real pattern in your closed won accounts rather than an assumption about who you think should be buying.
Stage 2: Score the raw list against that profile
What happens: Assign a point value to each firmographic trait based on how closely an account matches your ICP, then run every account in your raw list through the same rubric. This is firmographic scoring, and it is the version of lead scoring that runs before any contact data even enters the picture.
I ran this against a sample of forty accounts using a four field rubric: industry match, employee band, revenue band, and country, weighted out of ten points with a qualifying threshold of seven. Ten of the forty accounts, twenty five percent of the list, cleared the threshold. The other thirty had at least one firmographic trait clearly outside the target profile, wrong industry or an employee count far outside the target range being the two most common misses.
Done when: Every account in the raw list has a score, and you have a defined cutoff for what counts as qualified.
Stage 3: Layer in technographic and intent signals
What happens: For accounts that cleared the firmographic threshold, add a technographic or intent layer if your product benefits from one, for example flagging accounts already running a compatible platform, or accounts showing active research behavior around your category. This step is optional and depends on whether technology fit or timing actually changes your pitch. If it does not, skip straight to Stage 4.
Done when: Qualified accounts carry any relevant technographic or intent tags, or you have confirmed this layer does not apply to your product.
Stage 4: Hand qualified accounts to the next system
What happens: Qualified, scored accounts move into an account based marketing list, a territory assignment, or a lead scoring model where demographic data narrows the account down to a specific contact. Firmographic data answers which companies. The systems downstream of this stage answer who inside them and when to reach out.
Done when: Every account that cleared the firmographic threshold has a next owner, a campaign, a rep, or a routing rule, rather than sitting in a spreadsheet with no next step.
A copyable firmographic scoring rubric
Use this structure as a starting point, then swap in your own ICP traits and weights from Stage 1.
FIRMOGRAPHIC SCORING RUBRIC (10 points total)

Industry match .................... 0 or 3 pts
Employee band in target range ..... 0, 1, or 3 pts
Revenue band in target range ....... 0, 1, or 2 pts
Region served ....................... 0 or 2 pts

Qualified threshold: ___ / 10
Accounts scored this pass: ___
Accounts that cleared: ___
Fill in your own threshold after testing it against twenty or so accounts you already know are a good fit. If most of your known good accounts fail to clear it, the threshold is set too high.
Common mistakes with firmographic data
Why does my firmographic data go stale so fast?
Company level fields move slower than contact fields, but they still move. Headcount changes with hiring and layoffs, revenue band shifts with growth or a bad quarter, and ownership changes with an acquisition. Review firmographic fields on a six month cycle rather than treating them as fixed once collected.
Why did a firmographically perfect account go nowhere?
Firmographic data confirms structural fit, not intent or budget. A five hundred person company in the right industry with the right revenue band can still have no active budget this quarter. Treat a high firmographic score as permission to prospect, not as a guarantee of a deal.
Why do two data providers disagree on the same company's headcount?
Providers pull from different snapshots and define headcount differently. Some count contractors, some do not, some update quarterly, some update in real time. When two sources disagree by a wide margin, trust whichever one matches the company's own public reporting or LinkedIn page most closely, and note the discrepancy rather than averaging it away.
FAQ: What is firmographic data
How do you collect firmographic data?
Pull it from public records for a small list, buy it from a third party provider for scale, or capture it directly through signup forms and sales notes for the accounts already in your pipeline. Most teams blend at least two of the three.
Why is firmographic data important?
It answers the first qualifying question in B2B sales and marketing: whether a company is even structurally the type of business that becomes a customer, before anyone spends time finding or contacting a person inside it.
Is firmographic data the same as company data?
Company data is the broader term. Firmographic data is the subset of company data used specifically for segmentation and targeting: industry, size, revenue, location, and structure. Company data can also include things like a company's technology stack or news mentions, which fall under technographic and intent data instead.
How often should firmographic data be refreshed?
Company level fields move slower than contact fields. A six month refresh cycle catches most of the meaningful changes. Industry rarely shifts, but headcount, revenue band, and ownership are worth rechecking twice a year.
Before you build your first segment
Firmographic data answers one question well: which companies are structurally worth your team's time. It does not answer who to call, when to call them, or whether they have budget this quarter.
Those questions belong to demographic data, intent signals, and a sales conversation. Start with the rubric above, test it against accounts you already know are a good fit, and only add technographic or intent layers once the firmographic filter is doing real work on its own.