Sales velocity: Calculate your pace and see why more deals can bring in less
Calculate sales velocity with four CRM inputs. See why it can fall when your pipeline grows, and use a worked example to find what is slowing sales.
 Michael Doyle9 min read

Sales velocity estimates how much deal value your sales pipeline can turn into signed business each day.
Multiply the number of qualified open deals by the average value of a won deal and your win rate. Divide by the average sales cycle in days.
In a worked example, 120 deals at $10,000 each, a 25% win rate, and a 60-day cycle give you $5,000 per day.
A larger pipeline can still sell more slowly. If you win a smaller share of deals or take longer to close them, the extra opportunities may barely help.
Use the same four numbers in each review to see which part of your sales process needs attention.https://www.leaderr.io/blog/lead-quali
What you need to measure sales velocity
Pull a list of open deals from your CRM, the system where you track deals and their stages. Pick a date for the count and one group of deals, such as sales to small businesses.
Use the same group when you pull past results. If you combine small and large contracts, a change in the mix can move the average before any team has changed how it sells.
Have these records ready before you calculate:
A dated count of open deals that meet your lead qualification rules.
The value, close date, and outcome for each qualified deal that closed in your chosen period.
The date each won deal reached the stage where your team counts it as qualified.
Use the same length of history for each review. For example, start with the previous 90 days if enough deals closed.
Longer sales cycles or a small number of closed deals may call for a longer window. Record the window beside each result so someone else can repeat the calculation.
How to calculate sales velocity from your CRM
Use this sales velocity formula:
Sales velocity = (qualified open deals × average won deal value × win rate) ÷ average sales cycle in days
The first three numbers estimate the value you might win from the open pipeline. Dividing by the average cycle gives you an estimated pace in dollars per day.
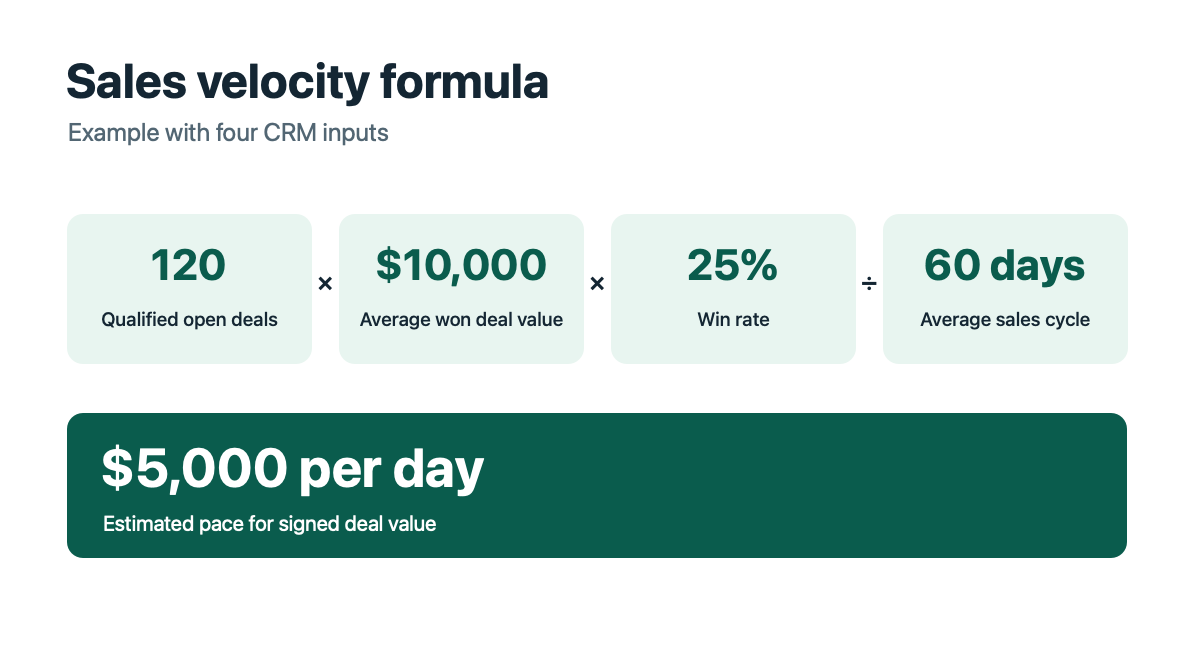
The time unit comes from the sales cycle. A cycle measured in calendar days gives you a daily estimate based on calendar days.
Count qualified open deals
Take a snapshot, or a count on one date. Count deals that are open and have reached your chosen qualification stage by that date. Use the historical snapshot for the earlier period.
Counting every deal created during a month gives you a different number. For help with setting stages and keeping them full, see how to build a sales pipeline.
Calculate average won deal value
Add the value of all qualified deals you won in your review period. Divide by the number of those wins. Use the same currency and the same type of value across both periods.
For example, if you use the first year of contract value for one deal, apply the same rule to the others.
Calculate win rate
Divide won deals by the sum of won and lost deals. If you won 25 out of 100 deals that closed, the win rate is 25%. Leave open deals out of this part of the calculation.
Salesforce describes the measure as “the percentage of Closed Won Opportunities to Closed Opportunities (won and lost).” Win rate reporting definition
Measure the average sales cycle
For each won deal, count the days from qualification to the signed date. Add those durations and divide by the number of wins.
Some CRM reports start the clock when the deal record is created. If you use that starting point, use it in both periods and label it in your report.
Why sales velocity falls when your pipeline grows
In this example, a sales team adds 30 qualified opportunities. Average won deal value stays at $10,000.
The team also wins fewer of its closed deals, and the deals it does win take 15 days longer.
Input | Previous review | Current review |
|---|---|---|
Qualified open deals | 120 | 150 |
Average won deal value | $10,000 | $10,000 |
Win rate | 25% | 18% |
Average sales cycle | 60 days | 75 days |
Sales velocity | $5,000 per day | $3,600 per day |
First, calculate the previous pace. Multiply 120 by $10,000 and 25% to get $300,000. Divide by 60 days to get $5,000 per day.
Then calculate the current pace. Multiply 150 by $10,000 and 18% to get $270,000. Divide by 75 days to get $3,600 per day.
The drop is $1,400 per day, or 28%.
Change one input at a time
Start at $5,000 per day. Change only the open deal count from 120 to 150. The pace rises to $6,250 per day.
Change the win rate from 25% to 18%, with the other inputs held in place. The pace falls to $4,500 per day.
Change the sales cycle from 60 to 75 days. The pace falls again to $3,600 per day.
The order affects the size of each step because the inputs multiply together. The chart shows what happens when you apply the changes in this order.
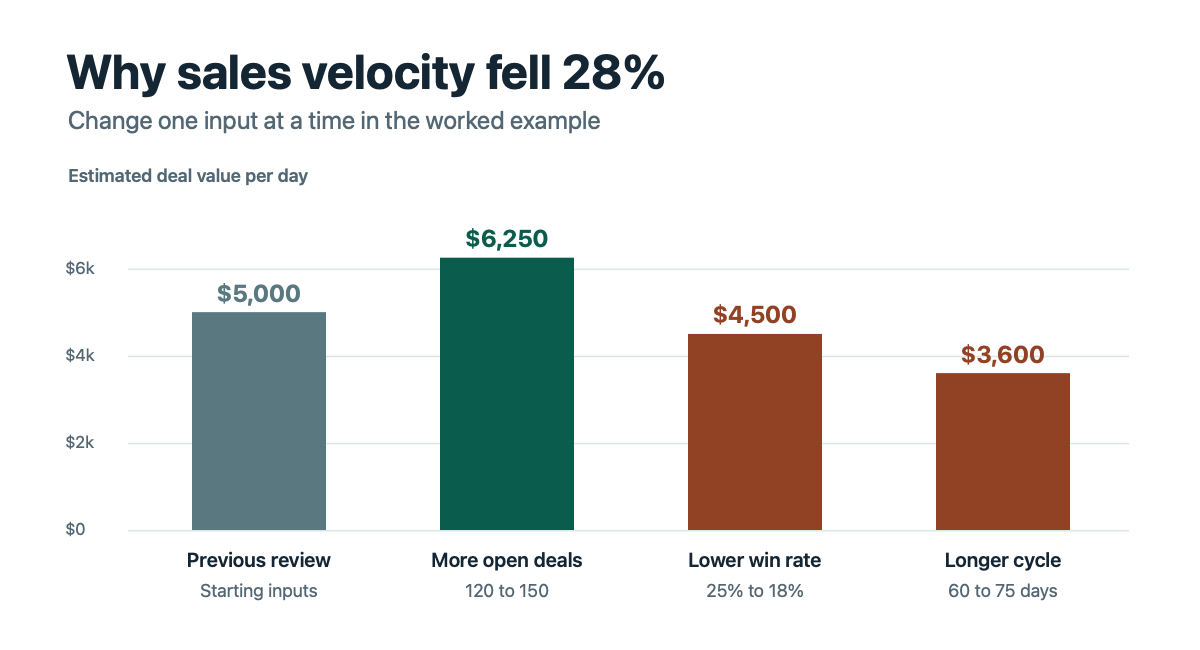
Start with the lower win rate in this example. Then check which stages kept deals open longer.
Build a sales velocity calculator in Excel
Use one row for each dated review. Keep the same deal filters and cycle start date in every row so you can compare the results later.
Cell | Input | Example |
|---|---|---|
B2 | Qualified open deals | 120 |
C2 | Average won deal value | $10,000 |
D2 | Win rate | 25% |
E2 | Average cycle in calendar days | 60 |
F2 | Sales velocity | $5,000 per day |
Enter =B2*C2*D2/E2 in F2 and format the result as currency. Type 25% in D2, or enter 0.25 and apply percentage formatting.
Entering 25 as a plain number makes the output 100 times too high. How to enter and format percentages
How to find what is slowing sales
Compare the four inputs before deciding what to change. Then look at the underlying deals, starting with the part that moved.
Check the win rate by lead source
Split deals by how buyers found you. Compare inbound deals, where buyers came to you, with outbound deals, where your team contacted buyers first. Write down wins and losses for each group.
If each group wins at about the same rate as before, check whether more of the closed deals came from the group with the lower win rate. A change in the mix can pull down the combined rate.
Check how long deals spend in each stage
Look at the time deals spend in proposal, approval, and procurement, the buyer's purchasing process. An r/sales discussion about a buyer going quiet during procurement shows why it helps to ask who owns the next step.
If the same delay appears across several deals, agree on a date and a person for the next buyer action.
For a deal that has stopped moving, review these sales closing techniques for stalled deals.
Check deal value and new opportunities
If average deal value fell, see whether the team offered larger discounts or closed more small contracts. If qualified opportunities fell, check the number of new qualified deals by source.
If open opportunities rose, compare new deals with older deals that have stayed open past their usual stage time.
A bigger total can come from either source. How time in stage is measured
What to do when the CRM numbers look wrong
The old count is missing. Use a saved report or dated export if you have one. Otherwise start recording snapshots now and leave the old count blank.
The review period has no wins. Leave average deal value, average cycle, and velocity blank. Try a longer window and apply the same window to both reviews.
The cycle comes out as zero days. Check for missing dates or a batch of deals that started and closed on the same calendar day. If that reflects how the team sells, use a finer time unit and label the result accordingly.
The win rate changes sharply on a small sample. Look at the closed deal counts before changing your process. One extra win across five closed deals moves win rate by 20 percentage points.
What is a good sales velocity?
Use your past pace for the same group of deals as a baseline. If the target is $150,000 in signed business over 30 days, divide $150,000 by 30 to get a planning pace of $5,000 per day.
Use that number to see how far the current pace is from the target.
For a month-end call, check the deals that could close in that month, who still has to approve them, and when they can sign. Those details belong in your sales pipeline forecast.
Sales velocity questions
Is pipeline velocity the same as sales velocity?
In many B2B reports, pipeline velocity and sales velocity use the same four inputs. Some teams also use velocity to describe how fast a deal moves between stages. Check the formula and the unit before comparing reports.
What is the difference between sales velocity and sales cycle length?
Sales cycle length measures how many days a deal takes to close. Sales velocity estimates how much deal value a pipeline can turn into signed business each day.
A longer sales cycle reduces velocity when the other three inputs stay the same.
How often should you calculate sales velocity?
Choose a regular review date your team can repeat. A weekly snapshot can show changes in open deals. Monthly comparisons may be easier to read when your team closes few deals each week.
Keep the historical window consistent so a new result has a fair comparison.
How can you improve sales velocity?
Start with the input that changed and check the deals behind it. For example, if proposals are taking longer, ask buyers when the decision will be made and who needs to sign.
Review time in that stage again after the change.
Pick one change for the next pipeline review
Save this period’s four inputs and name the deal group beside them. Give one person a specific issue to check before the next review.
If the report shows slower approvals, ask that person to look for the stage where the delay starts and confirm it against the deal notes.
Guidance and sources reviewed November 11, 2026.